For .NET Framework 2.0 and later, Microsoft licensed the Dundas charting controls to bring charting support to .NET Windows Forms (and ASP.NET). The namespace System.Windows.Forms.DataVisualization is now officially deprecated, but the .NET team at Microsoft kept the door slightly open by publishing the sources on GitHub to enable charting features for WinForms applications that are developed on .NET Core 3 and better.
.NET Compatible Fork
Based on this repository, there are multiple forks including this fork that added .NET 6 support:
https://github.com/kirsan31/winforms-datavisualization
If you clone this repository, build the System.Windows.Forms.DataVisualization.dll and reference it in your project, you can directly use these charts within a .NET 6 Windows Forms application:
| // create a new chart control | |
| Chart chart = new Chart(); | |
| // add a chart area | |
| chart.ChartAreas.Add("chartArea1"); | |
| chart.Series.Add("series1"); | |
| chart.Series["series1"].ChartArea = "chartArea1"; | |
| chart.Series["series1"].ChartType = SeriesChartType.Bar; | |
| // connect to a data source | |
| DataSet ds = new DataSet(); | |
| ds.ReadXml("data.xml"); | |
| chart.Series[0].XValueMember = ds.Tables[0].Columns[0].ColumnName; | |
| chart.Series[0].YValueMembers = ds.Tables[0].Columns[1].ColumnName; | |
| chart.DataSource = ds.Tables[0]; | |
| chart.DataBind(); | |
| // create a chart frame | |
| TXTextControl.DataVisualization.ChartFrame frame = | |
| new TXTextControl.DataVisualization.ChartFrame(chart); | |
| frame.Name = "points"; | |
| // add chart to the document | |
| textControl1.Charts.Add(frame, -1); |
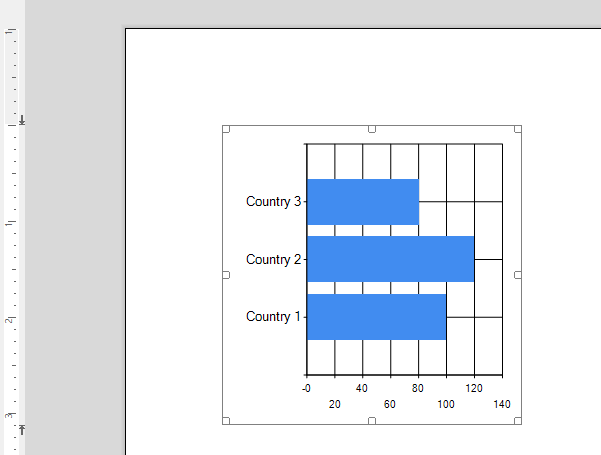
The following XML is used as the sample data source:
| <?xml version="1.0" encoding="utf-8" ?> | |
| <sales> | |
| <points> | |
| <country>Country 1</country> | |
| <value>100</value> | |
| </points> | |
| <points> | |
| <country>Country 2</country> | |
| <value>120</value> | |
| </points> | |
| <points> | |
| <country>Country 3</country> | |
| <value>80</value> | |
| </points> | |
| </sales> |
The result can be seen in the following screenshot:

TX Text Control Fork
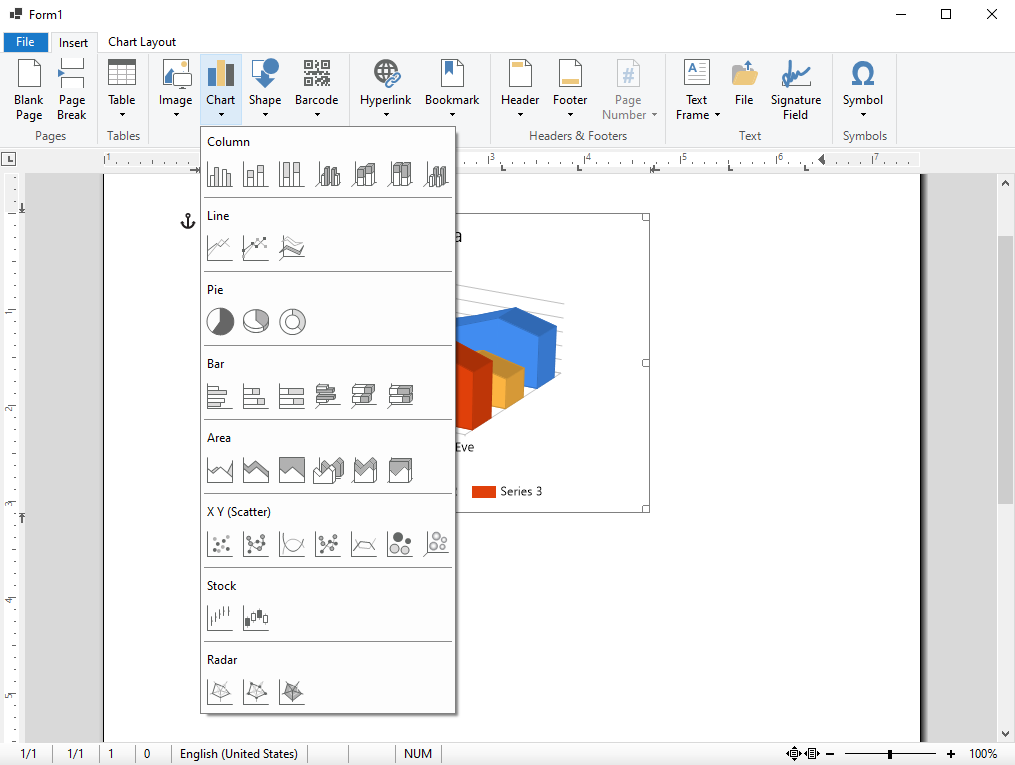
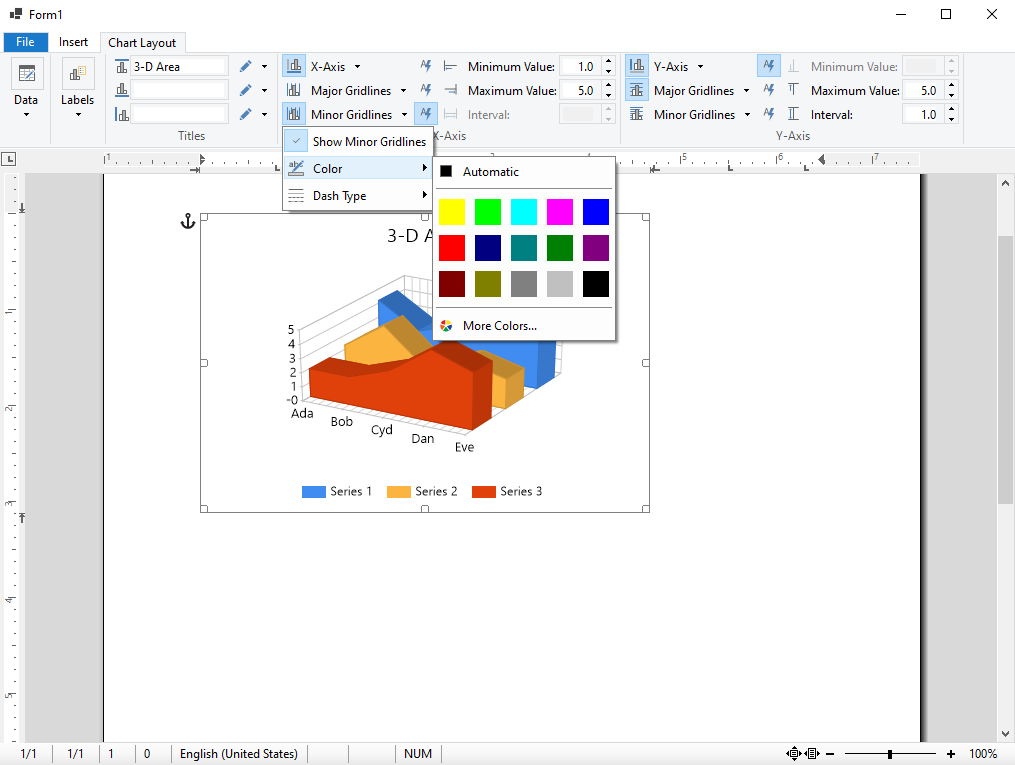
We forked this repository to make it compatible to TX Text Control .NET for Windows Forms. If you want to use the out-of-the-box ribbon tabs to insert and format added chart objects, you can clone our fork of the repository.
https://github.com/TextControl/winforms-datavisualization
In order to integrate this version, the following steps must be followed.
-
Clone the repository and open it in Visual Studio.
https://github.com/TextControl/winforms-datavisualization -
Find the created NuGet package System.Windows.Forms.DataVisualization.1.0.0.nupkg in the Release or Debug folder and copy that into the Text Control Offline Packages folder:
C:\Program Files (x86)\Text Control GmbH\NuGetPackages -
In your Windows Forms application, select the project in the Solution Explorer and click Project -> Manage NuGet Packages... from the main menu.
-
Select Text Control Offline Packages as the Package source and click Browse.
-
Select System.Windows.Forms.DataVisualization and click Install.
When using the RibbonInsertTab and RibbonChartLayoutTab in your application, the added charting control is recognized automatically and the charting functionality is enabled.


