









Build a What-If Business Simulator with TX Sheet Control

The What-If Business Simulator uses TX Sheet Control to forecast 24 months for a fictional SaaS company. Change pricing, churn, or spending in the workbook or scenario controls, then compare projected revenue, operating profit, and cash across three independently editable scenarios.
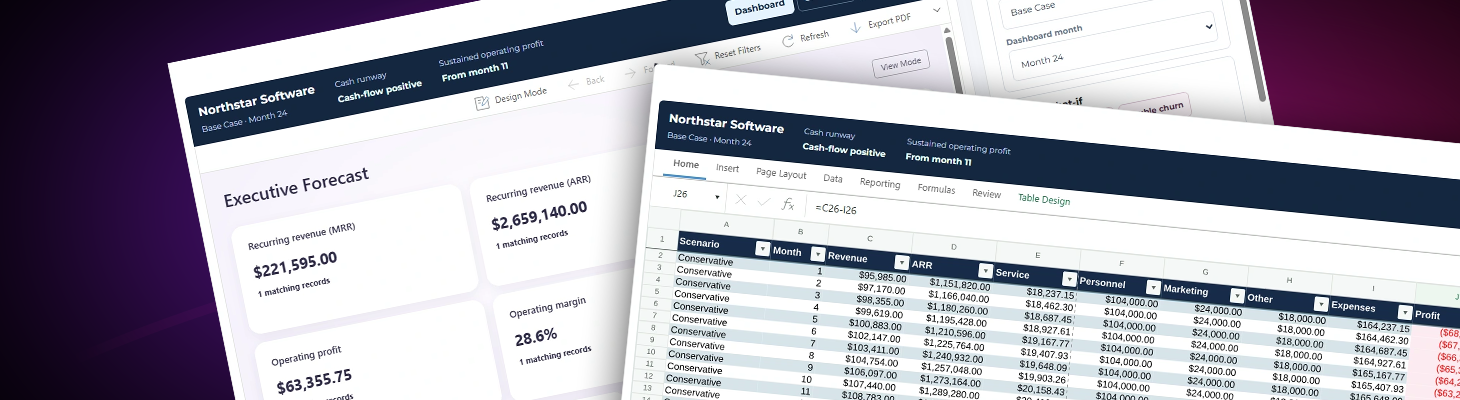
What happens to cash if monthly churn doubles? How long will a price increase take to show up in operating profit? The What-If Business Simulator lets you explore those questions in a 24-month forecast for Northstar Software, a fictional subscription business.
The sample combines an ASP.NET Core host with the TX Sheet Control browser editor. Sliders and numeric inputs change worksheet assumptions. Spreadsheet formulas calculate the forecast, and native dashboards visualize the results from the same workbook.
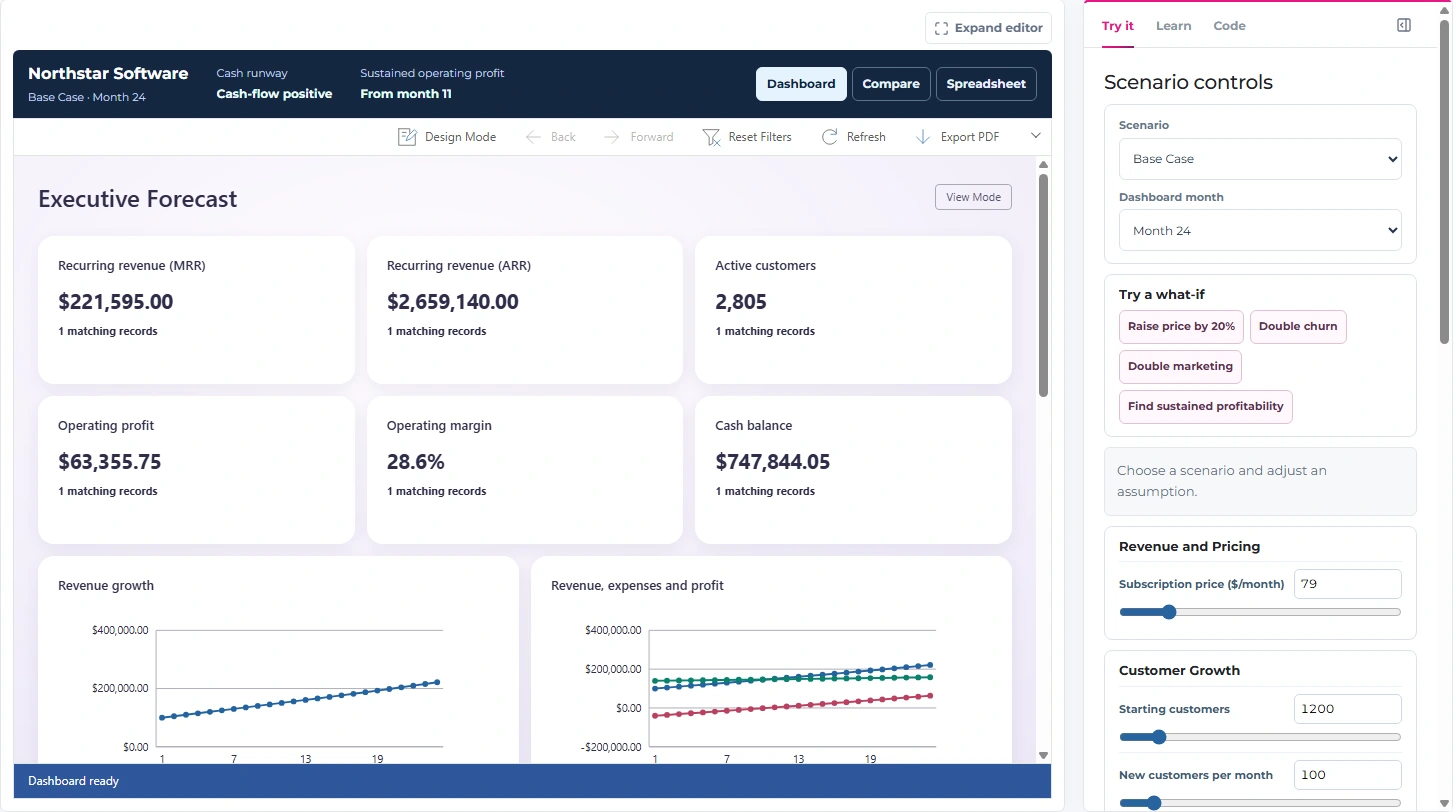
Build the Forecast in the Workbook
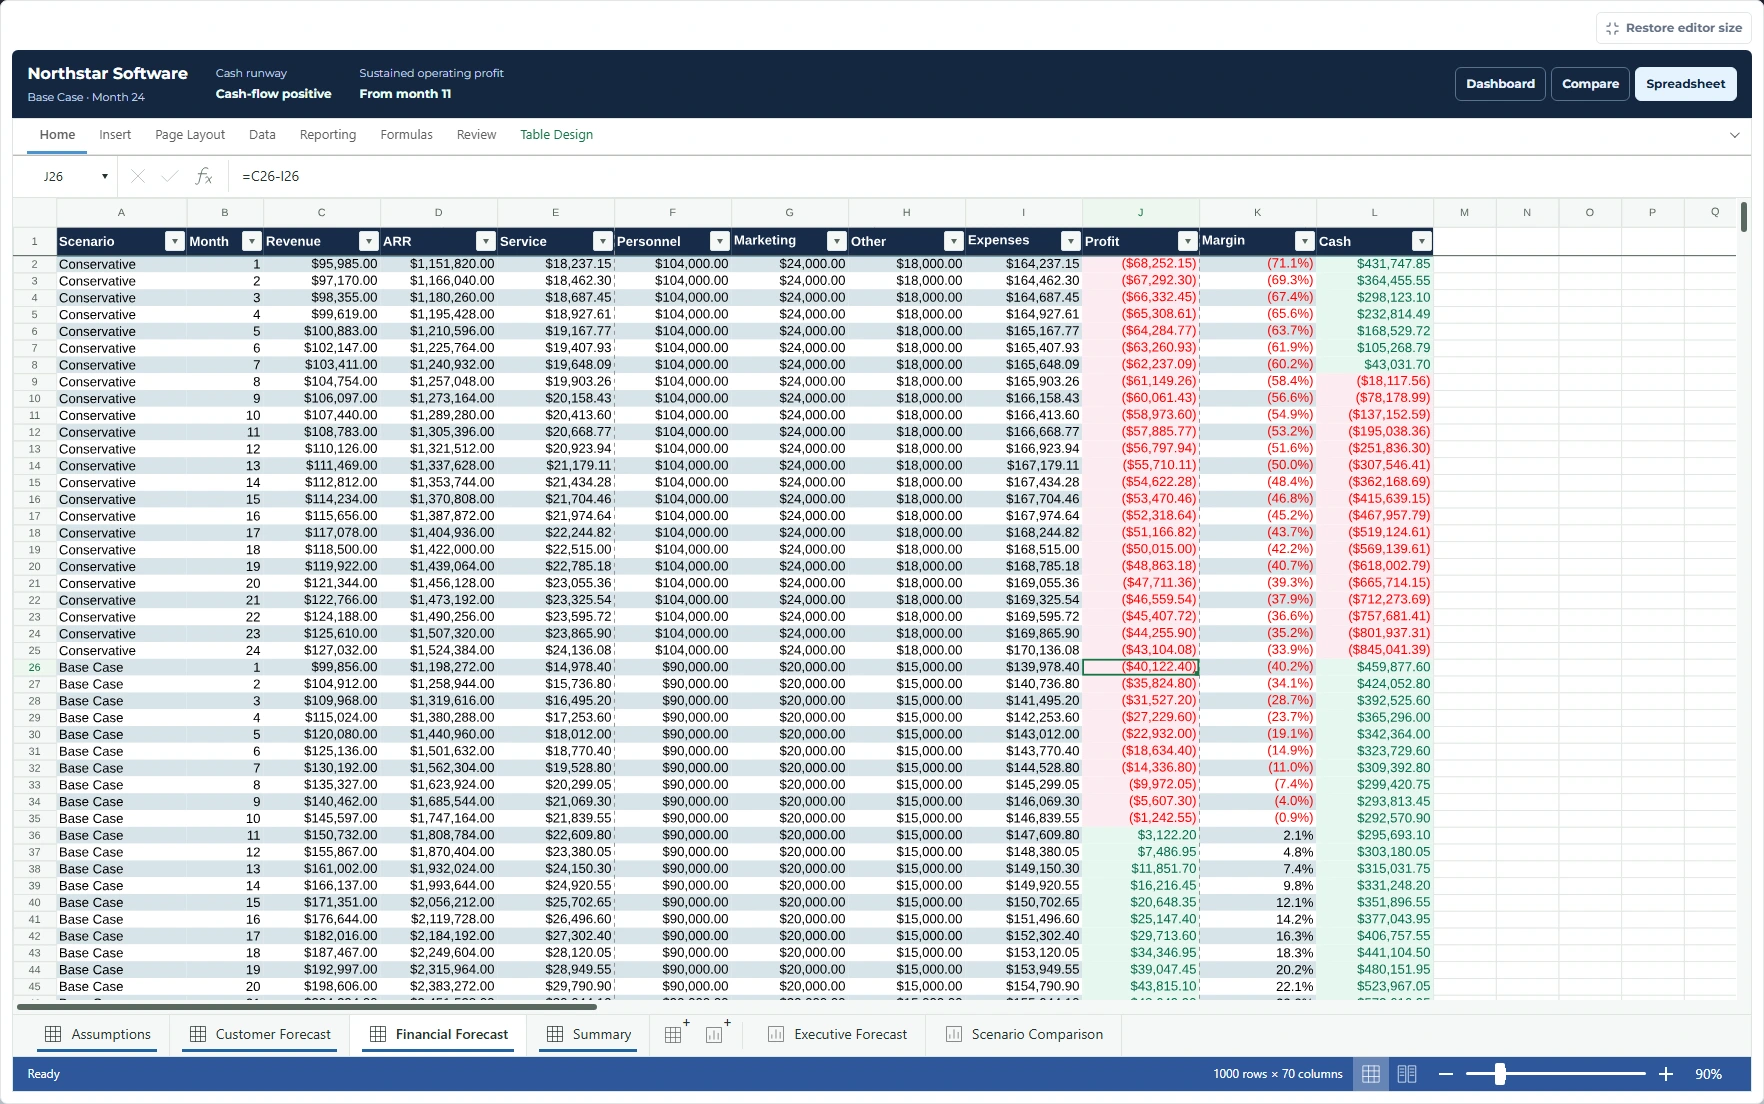
Four worksheets make the model easy to inspect. Assumptions holds a separate column for each scenario. Customer Forecast projects acquisitions, churn, and active customers. Financial Forecast turns those customer counts into revenue, expenses, profit, and cash. Summary feeds the executive and comparison dashboards.
The forecast rounds acquisition and churn to whole customers each month and carries the full precision of monetary calculations. For example, row 26 is month 1 of the Base Case on the Financial Forecast sheet. These formulas calculate revenue, operating profit, margin, and ending cash:
C26  ='Customer Forecast'!F26*Assumptions!C2
J26  =C26-I26
K26  =IFERROR(J26/C26,0)
L26  =Assumptions!C12+J26
Cash rolls forward from month to month using operating profit as a proxy for cash flow. The model excludes taxes, financing, capital spending, and working-capital timing. If the selected month has an operating loss, the runway estimate uses that loss and the remaining cash. The sustained-profit indicator finds the first month from which operating profit stays positive through month 24.
Connect the Controls to Worksheet Cells
The slider and numeric field write to the same cell in the selected scenario. With the Base Case selected, for example, a 20% price increase changes the subscription price from $79 to $94.80 in Assumptions!C2. The core workbook update looks like this:
const book = editor.workbook;
const assumptions = book.sheets.get("Assumptions");

assumptions.cell("C2").setValue(94.8);
await book.calculation.recalculateAsync();
The demo listens to Workbook.onChange() so an edit made directly in the worksheet also updates the scenario controls. It coalesces changes on an animation frame before asking the workbook to recalculate. The controls use the existing forecast and dashboard definitions throughout.
Query Formula-Backed Tables from the Dashboard
The Summary sheet exposes the selected scenario's monthly results through a table named ScenarioTrend. The example below uses the workbook analytics API to resolve the table's field IDs and add a native revenue chart to the executive dashboard.
const source = book.analytics.sources()
    .find(item => item.name === "ScenarioTrend");
const fields = Object.fromEntries(book.analytics.profile(source.id)
    .fields.map(field => [field.name, field.id]));

dashboard.addWidget({
    id: "revenue",
    type: "line",
    title: "Revenue growth",
    placement: { x: 0, y: 6, width: 6, height: 9 },
    query: {
        sourceId: source.id,
        dimensions: [fields.Month],
        measures: [{ field: fields.Revenue, alias: "Revenue", aggregation: "SUM" }],
        sort: { field: fields.Month }
    }
});
The other widgets use the same approach to display profitability, customer growth, projected cash, and the operating cost breakdown. When an assumption changes, those widgets query the updated worksheet values.
Compare Three Business Scenarios
The Base Case, Conservative, and Optimistic scenarios run through the same forecast formulas. Each keeps its own assumptions when you switch away. The comparison dashboard puts month-24 revenue and operating profit on side-by-side charts and shows ARR, active customers, and cash in the accompanying table.
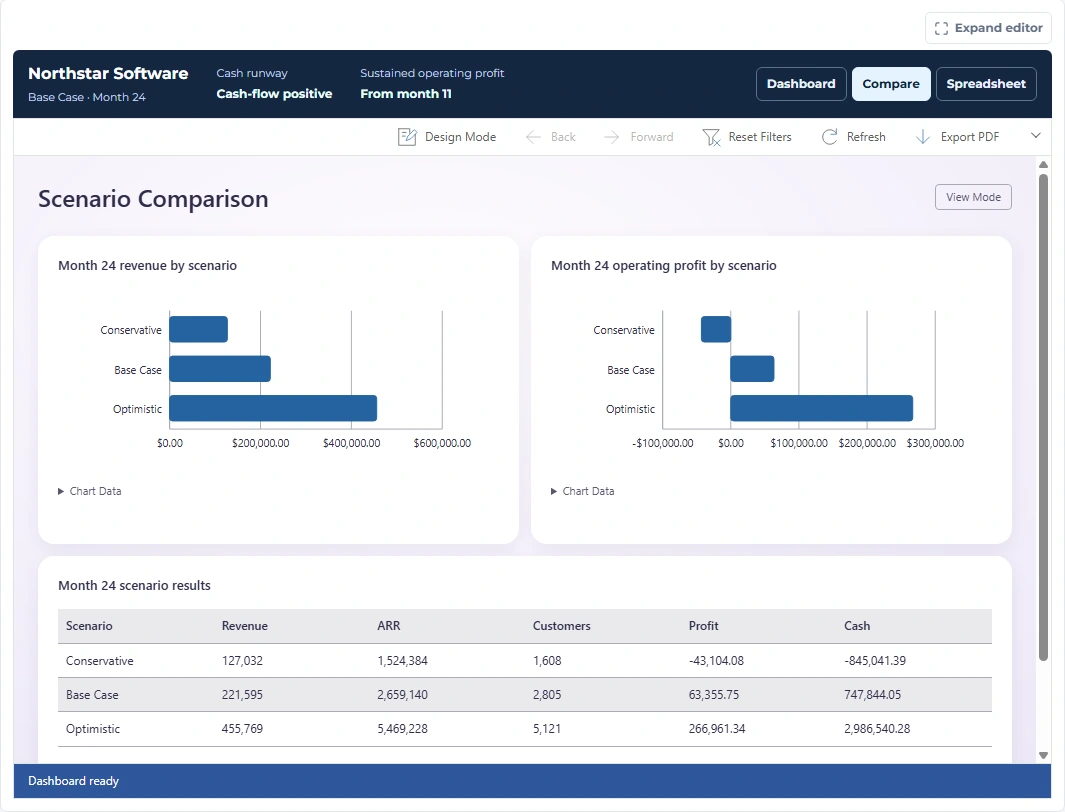
Try doubling churn or increasing the subscription price, then switch to Compare to see what changed. Doubling marketing adds expense while acquisition stays at its configured rate. Download the workbook as TXWB to retain the native dashboards, or as XLSX to take the worksheet formulas into Excel. Reopen the exported XLSX in the simulator to rebuild its standard dashboards from the worksheet tables.
Related Posts
JavaScriptASP.NET CoreTX Sheet Control
Live Stock Quotes in a C# .NET App with TX Sheet Control
The TX Sheet Control stock market demo streams simulated quotes for 16 fictional companies into a worksheet. See how batch updates drive formula recalculation, volume bars, directional icons, and…
JavaScriptASP.NET CoreDOCX Editor
How to Embed a DOCX Editor in a Web Application (ASP.NET Core)
This tutorial shows how to embed a DOCX editor in an ASP.NET Core web application with TX Text Control. It covers setting up the editor, loading a DOCX document, and editing it with true WYSIWYG…
DOCX Editor SDK: A Complete Evaluation Guide and Checklist
The right DOCX Editor SDK brings Microsoft Word-like editing into your web application and fits your technical and business requirements. This guide covers the capabilities and business…
Build a Custom Backstage View in ASP.NET Core with TX Text Control
This article shows how to build a custom backstage view with a File tab to load your multi-format documents using TX Text Control for ASP.NET Core applications.
5 Document Workflows You Can Automate With JavaScript Rich Text Editor
Enterprise JavaScript rich text editors outperform open source and basic alternatives for document automation. This guide covers five document workflows with TX Text Control: contract generation…