TX Text Control X8: Inserting Chart Controls
TX Text Control .NET for Windows Forms X8 now supports the insertion of chart controls of the type DataVisualization.Charting.Chart. It is part of the .NET Framework since version 4.0, but can be added to prior versions as well. A chart can be positioned like an image or textframe, either geometrically or as a single character. The new ChartFrame class handles the positioning of the chart in a document. Such a ChartFrame is always associated with a Chart control that handles the appearance…


TX Text Control .NET for Windows Forms X8 now supports the insertion of chart controls of the type DataVisualization.Charting.Chart. It is part of the .NET Framework since version 4.0, but can be added to prior versions as well.
A chart can be positioned like an image or textframe, either geometrically or as a single character.
The new ChartFrame class handles the positioning of the chart in a document. Such a ChartFrame is always associated with a Chart control that handles the appearance and the data of the chart.

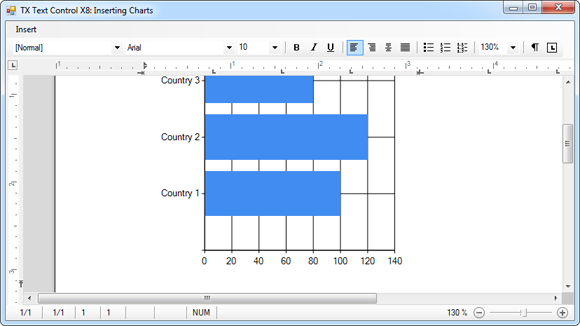
The goal in this sample is to insert a bar chart filled with XML data into a document. The following XML data should be used:
<?xml version="1.0" encoding="utf-8" ?>
<sales>
    <points>
      <country>Country 1</country>
      <value>100</value>
    </points>
    <points>
      <country>Country 2</country>
      <value>120</value>
    </points>
    <points>
      <country>Country 3</country>
      <value>80</value>
    </points>
</sales>
In order to insert a chart diagram into the document, we need to create a new chart. Make sure that a reference to System.Windows.Forms.DataVisualization.Charting.Chart has been added to your project.
Each chart object needs a ChartArea that represents a chart area on the chart image and a Series object that is connected to that area.
Chart chart = new Chart();
chart.ChartAreas.Add("chartArea1");
chart.Series.Add("series1");

// set the ChartType
chart.Series["series1"].ChartArea = "chartArea1";
chart.Series["series1"].ChartType = SeriesChartType.Bar;
In a next step, we can load the XML into a DataSet. The column names are used to set the member of the chart data source used to bind the X and Y values of the series.
DataSet ds = new DataSet();
ds.ReadXml("data.xml");

chart.Series[0].XValueMember = ds.Tables[0].Columns[0].ColumnName;
chart.Series[0].YValueMembers = ds.Tables[0].Columns[1].ColumnName;
Finally, the first table of the DataSet is specified as the data source for the Chart object. A new ChartFrame is created and inserted into the Charts collection of TX Text Control.
chart.DataSource = ds.Tables[0];
chart.DataBind();

ChartFrame chartFrame = new ChartFrame(chart);
textControl1.Charts.Add(chartFrame, -1);Related Posts
Fresh from Our Labs: Adobe PDF Import Improvements
I was just able to get hold of the latest builds fresh out of our development labs. Our engineering is currently working on innovative new features for version 18.0 of TX Text Control. In this…
Updating TX Text Control
In the past few weeks, I have had several support cases that have been about updating TX Text Control. The steps that need to be performed when updating are very dependent upon the exact version…
TX Text Control 34.0 SP2 is Now Available: What's New in the Latest Version
TX Text Control 34.0 Service Pack 2 is now available, offering important updates and bug fixes for all platforms. If you use TX Text Control in your document processing applications, this service…
TX Text Control 34.0 SP1 is Now Available: What's New in the Latest Version
TX Text Control 34.0 Service Pack 1 is now available, offering important updates and bug fixes for all platforms. If you use TX Text Control in your document processing applications, this service…
Introducing TX Text Control 34.0: Your Next Leap in Document Processing.
We are happy to announce the release of TX Text Control 34.0. This version is packed with new features and enhancements that will elevate your document processing experience. This version…

