Sneak Peek: Text Control Adds Powerful 2D and 3D Charting Support
Powerful data visualizations in a report or any other document are essential to get the "big picture". Charts indicate trends and can be used to attractively visualize large volumes of data. We are currently working on a full integration of powerful 2D and 3D charts for TX Text Control .NET for Windows Forms. Bars, donuts, pies or financial series - more than 30 fully programmble diagram types can added using the new ChartCollection. The TextControl.ChartLayoutDialog alters layout settings,…


Powerful data visualizations in a report or any other document are essential to get the "big picture". Charts indicate trends and can be used to attractively visualize large volumes of data.
We are currently working on a full integration of powerful 2D and 3D charts for TX Text Control .NET for Windows Forms.
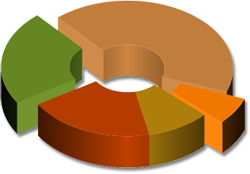
Bars, donuts, pies or financial series - more than 30 fully programmble diagram types can added using the new ChartCollection. The TextControl.ChartLayoutDialog alters layout settings, size and text distances of an inserted chart.
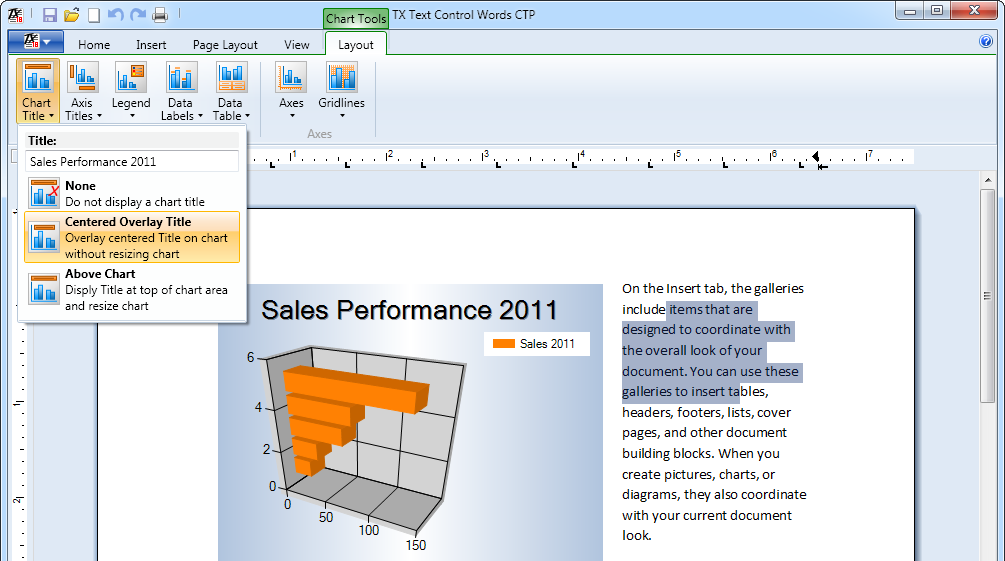
The following screenshot shows a sample implementation of the chart integration into a TX Text Control based application. Every chart object is fully programmable which gives you flexible possibilities to integrate chart support into your own business applications.
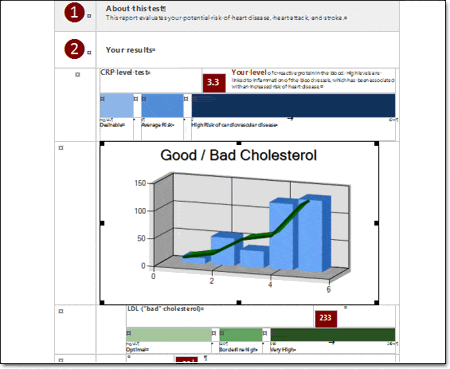
Just like TextFields or ApplicationFields, you can iterate through the embedded charts in order to populate them with data. This gives developers the possibility to create a template in TX Text Control that includes a fully styled chart object as a placeholder with a unique name. This chart is pre-configured with the chart type, preferred colors, title strings and many other settings.
During the merge process, the chart is dynamically updated to reflect the actual data:
This concept allows you to create true WYSIWYG templates for your reports. The size and style of charts are added at design-time and merged dynamically.
Another great idea from Text Control that reflects our leadership in word processing components. Innovate - don't imitate! Be the first to get hands-on these features and get a Subscription that includes all major updates within 12 months.
Reporting
The Text Control Reporting Framework combines powerful reporting features with an easy-to-use, MS Word compatible word processor. Users can create documents and templates using ordinary Microsoft Word skills. The Reporting Framework is included in all .NET based TX Text Control products including ASP.NET, Windows Forms and WPF.
Related Posts
TX Text Control 32.0 Has Been Released
We are pleased to announce the immediate availability of TX Text Control 32.0 for all platforms including ASP.NET, Windows Forms, WPF and ActiveX.
TX Text Control 31.0 and TX Spell .NET 10.0 Have Been Released
We are happy to announce the immediate availability of TX Text Control 31.0 for all platforms including ASP.NET, Windows Forms, WPF and ActiveX and TX Spell .NET 10.0 for all .NET based platforms.
TX Text Control 30.0 and TX Spell .NET 9.0 Have Been Released
We are happy to announce the immediate availability of TX Text Control 30.0 for all platforms including ASP.NET, Windows Forms, WPF and ActiveX and TX Spell .NET 9.0 for all .NET based platforms.
TX Text Control X19 and TX Spell 8.0 Have Been Released
We are happy to announce the immediate availability of TX Text Control X19 for all platforms including Windows Forms, WPF and ASP.NET and TX Spell .NET 8 for all .NET based platforms.
TX Text Control for Angular X18 Published
We just published the npm packages for TX Text Control for Angular X18.


